讓Grafana與Prometheus監控你的服務器
利用Grafana + Prometheus可以簡單的監測Kubernetes Cluster的狀態 先簡單的利用Helm直接Deploy兩者
dependencies:
- name: grafana
  version: 0.6.1
  repository: https://kubernetes-charts.storage.googleapis.com/
  alias: grafana
- name: prometheus
  version: 5.1.0
  repository: https://kubernetes-charts.storage.googleapis.com/
  alias: prometheus
之後利用values.yaml設定Prometheus
留意scrape_interval需要設定比較短的時間,grafana的一些報表才會正確顯示出來(這裡設定成20s)
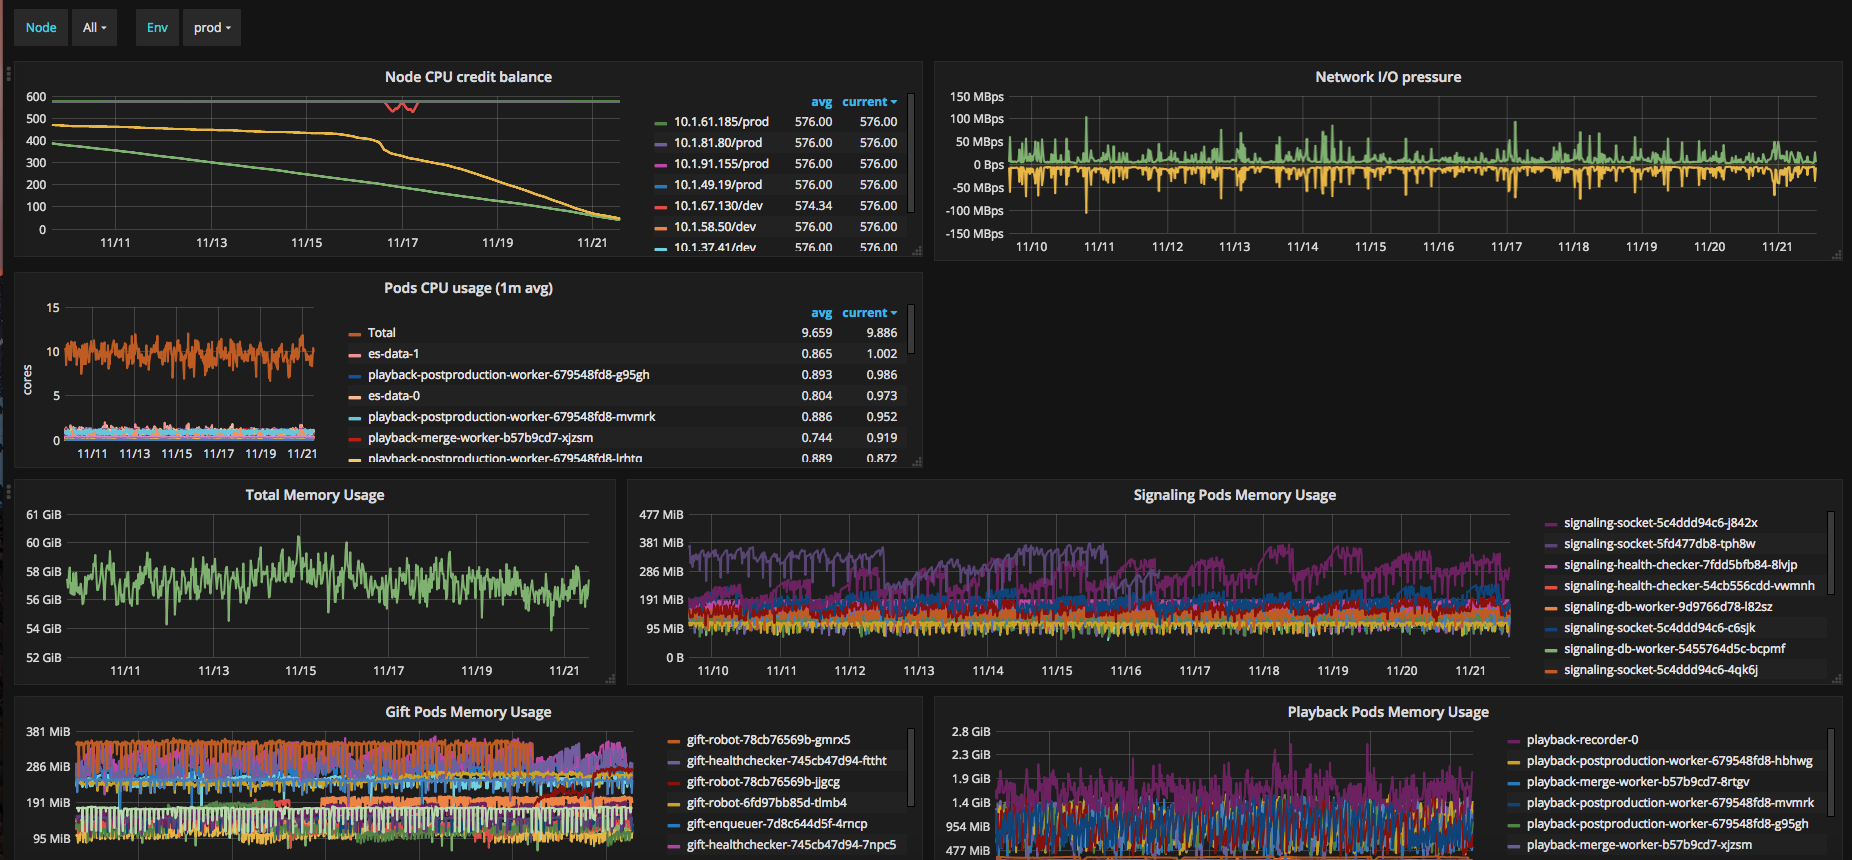
Grafana中直接導入已預設好的dashboard https://grafana.com/dashboards/315
簡單又漂亮的報表就完成囉
 當然若果要自行客製化的話就需要學會一些Prometheus及Grafana的Query language
兩者都並不困難
這邊提供一個簡單的方法去瀏覽Prometheus所儲存的數據
當然若果要自行客製化的話就需要學會一些Prometheus及Grafana的Query language
兩者都並不困難
這邊提供一個簡單的方法去瀏覽Prometheus所儲存的數據
# 先找出prometheus 的POD
kubectl -n [namespace] get pods | grep prometheus

# 然後用port forward把prometheus的port轉接到本機上
kubectl -n [namespace] port-forward [prometheus-pod-name] 9090然後打開http://localhost:9090就可以瀏覽prometheus的數據了